The Utility Business Model Is Built for a Different Era. Regulators Are Starting to Notice.
Post 1 of 10: The Potential Structural Transformation of the U.S. Electric Utility Industry

I left Octopus Energy last year, where I served as the US CEO. We spent a lot of time working on rate design, specifically how to use price signals to promote flexibility and shift load away from peak hours. It was genuinely innovative work, and I believed in it. We were optimizing how energy was consumed for power plant efficiency.
But throughout that work, I kept running into the same wall. We could never optimize our customer usage to reduce localized congestion on distribution or transmission networks. We could only optimize for the competitive markets which are the power plants. But poles and wires costs are becoming more than 50% of the costs in many markets and we were blocked from creating efficiency on this cost.
The utilities we worked with, the companies with the franchise rights, the physical infrastructure, and the regulatory access needed to actually move the grid forward, were often the hardest to move. The incentives pointed the wrong way. And the smarter the people I met inside those utilities, the more clearly they could articulate exactly why the incentives pointed the wrong way, and exactly why they could not do much about it.
That tension sent me down a rabbit hole that took most of the past year to work through. I met with utility executives, PUC commissioners, state senate and house energy committee chairs, governors’ staff, consumer advocates, and infrastructure investors. I visited state capitols and utility control rooms. I went in curiosity and an open mind.
What I found is that the people running utilities are largely not the problem. The economic model is. The way utilities earn money actively discourages the behavior needed to build a low-cost, customer-centric grid. Almost everyone inside the system knows this. The problem is that the current model is also how the industry, its vendors, its lawyers, its consultants, and its investors make money. Changing it requires someone to give something up. And in a regulated monopoly with no competitive pressure, nobody has to. Especially when stocks are trading at record highs.
This series is my attempt to lay out what I found, where the pressure is building, and what a better model might look like. There will be ten posts. This is the first.
The Boom
Start with what looks like good news, at least if you own utility stocks. Stocks are trading at historic high prices. It’s never been better. Nothing is broken.
The Edison Electric Institute projects more than $1.1 trillion in utility capital expenditure from 2026 to 2030. Morningstar has called it a “super-cycle” with their estimate at $1.4T. Wall Street analysts are broadly bullish. Earnings guidance is strong through the end of the decade. If you read the investor presentations, the story is one of a sector finally getting the investment it deserves, now supercharged by the data center buildout and the energy transition.
The individual company plans are staggering in scale:
Duke Energy has announced $103 billion over five years, projecting 9.6% earnings base growth and planning $10 billion in new equity issuance to fund it. That is roughly 50% of its current rate base.
Southern Company is planning $81 billion over five years, with a 9% rate base compound annual growth rate and an 8% EPS growth target.
WEC Energy has a $36.5 billion five-year plan, projecting 11% rate base growth and 7 to 8% EPS growth. Two data center customers totaling 3.4 gigawatts of load would increase WEC’s peak demand by 40% on their own.
Dominion Energy is planning $50.1 billion through 2029, targeting 5 to 7% EPS growth. Contracted data center capacity in Northern Virginia nearly doubled in a single quarter in late 2024, going from 21 gigawatts to 40 gigawatts of committed load.
Every major investor-owned utility is telling a version of this story. Massive capital deployment, strong regulated returns, predictable earnings growth. The pitch to investors is essentially: we have a legal monopoly, a guaranteed return on everything we build, at a rate of return without any market competition, and more assets to build than ever before.
That pitch is not wrong. But it contains a risk that most utility equity analysts are not fully pricing. Volatility is the new normal, not just in power markets, but perhaps also in regulation.
The Counter-Signal
While the utility sector is planning its largest capital expansion in a generation, a parallel set of conversations is happening in state capitals that point in a very different direction.
At least nine states are actively pursuing performance-based regulation as of early 2026, according to EQ Research. These are not fringe policy experiments. They represent a substantive and growing challenge to the financial logic that underlies utility equity valuations.
New Jersey’s Board of Public Utilities recently released an RFQ examining alternative utility business models, including explicit consideration of ROE (Return on Equity) reductions. This is notable not just for its substance but for its framing: the BPU is treating the question of what utilities should earn as an open question, not a settled one.
Virginia is actively debating PBR legislation. Hawaii has been operating under a PBR framework since 2020 and is in the process of evaluating what has and has not worked. Connecticut pursued PBR reforms and encountered implementation challenges that produced their own cautionary lessons.
The activity is uneven. Some states are focused primarily on compressing the allowed return on equity toward the actual market cost of equity. Others are building performance incentive mechanisms that reward utilities for delivering specific outcomes: better reliability, faster interconnection, higher customer satisfaction, progress toward clean energy targets. The most sophisticated approaches combine both: pay a market-based return on capital, and then create the opportunity to earn more by delivering outcomes customers actually value.
Those two things are not in conflict. But the details of implementation matter enormously. Early attempts to build performance-based frameworks have produced results that ranged from genuinely promising to deeply disappointing, sometimes within the same state. I will dig into the specifics, including what Hawaii’s PBR experiment has actually produced after five years, in a later post in this series.
The Social Permission Problem
There is a dimension to this that goes beyond regulatory economics, and I think it is underappreciated in the utility investment community.
Utilities operate under franchise rights granted by the state. The regulatory compact, the deal at the heart of the investor-owned utility model, is that the utility agrees to serve all customers within its territory at regulated rates, and in exchange, the state grants it a monopoly and allows it to earn a fair return on its investment. That deal is a legal construct. But it only functions because of an underlying social permission: customers accept the arrangement because they believe they are getting reliable power at a fair price.
When that belief erodes, the political dynamics change quickly.
Look at what customers are posting online about their electricity bills. Look at the politics of utility affordability in states where rates have risen sharply. In New Jersey, residential electricity prices rose 33% over two years. When Governor Sherrill took office, one of her first executive orders addressed utility affordability directly. That is a signal. When utility rates become a campaign issue and a first-day executive action, the social permission is breaking down.
Wildfire liability adds a different and more severe dimension to this problem. The 2023 Lahaina fire in Maui, which killed more than 100 people and caused billions in damages, was a vivid demonstration of what happens when a utility’s physical infrastructure becomes a catastrophic public hazard. The financial exposure from utility-caused wildfires is enormous and difficult to model. The reputational and political exposure compounds the financial one.
From a first principle, utilities sell trust. They happen to also sell electricity and build infrastructure, but they principally sell trust. Electricity is invisible. Customers cannot see, hold, taste, or smell it. They just get a bill 15 days after the month ends with a demand to pay or the lights turn off. This trust is destroyed if bills feel unfair or if tail risk events take place. Without this trust, everything else is in jeopardy.
Are Citizens Overpaying for Utility Return on Equity?
Here is the core financial issue, stated plainly.
Utilities are, at their heart, investment companies. They deploy capital into regulated assets, and they earn a regulated return on that capital. The business model is not fundamentally different from a bank or an asset manager: raise capital, deploy it, earn a spread. Except, unlike a bank, there is no competition.
Banks and other investment companies that compete for capital in open markets typically trade at roughly 1x book value, because competitive pressure brings returns toward the cost of capital. There is no persistent excess return available in a competitive market.
Utilities trade at roughly 1.3 to 2x book value. The premium exists because state regulators allow utilities to earn returns on equity that are substantially above the market cost of that equity. The allowed ROE at most major utilities runs between 9.5% and 11%. According to some, the actual market cost of equity for a large, stable, regulated utility is somewhere in the range of 6% to 7%, depending on your estimation methodology.
That gap, up to 300 to 400 basis points of excess return on a massive and growing equity base, is the source of the premium multiple. It is also what regulators are beginning to question.
Mark Ellis, a former executive at Sempra and now a senior fellow at the American Economic Liberties Project, has made this case with particular clarity. His argument is that the gap between allowed ROE and actual cost of equity is not a necessary feature of the regulatory system. It is an artifact of an estimation process that relies on utility-friendly methodologies and that lacks the competitive discipline that markets apply everywhere else.
His proposal is competitive direct equity: allow institutional investors to bid to provide equity capital to regulated utilities, the same way investors bid in debt markets or compete to buy shares at an IPO clearing price. Let the market determine the cost of equity. No estimation. No methodological debates about CAPM versus DCF. Just what investors are actually willing to accept in a competitive process.
This idea is not yet mainstream in regulatory proceedings. But it is intellectually serious, and the underlying problem it addresses, the persistent and large gap between allowed and actual cost of equity, is very real and increasingly visible to regulators under political pressure to address affordability.
The Earnings Sensitivity Most Analysts Are Missing
If allowed ROEs compress toward the actual cost of equity, the impact on utility equity values is not linear. It is compounded, because of how utility earnings and multiples interact.
In finance, the Gordon Growth Model gives us the framework. A utility’s sustainable earnings growth rate equals its ROE multiplied by its retention ratio (the share of earnings not paid out as dividends). At a typical 65% payout ratio, a utility retains 35% of earnings. Multiply that by the ROE, and you get the sustainable growth rate. That growth rate feeds directly into the P/E multiple the market is willing to assign.
The numbers below are illustrative rather than a projection for any specific company. I have scaled them to approximately $75 billion in book equity, which is roughly the projected equity base of a top-five U.S. utility by 2030 after planned rate base growth and new equity issuance.
Status quo: 10.5% ROE produces about 3.7% sustainable growth. At a 7% cost of equity, that implies roughly a 19x P/E, about $7.9 billion in net income, and a market cap of approximately $150 billion.
Modest compression to 9.0% ROE: sustainable growth drops to 3.2%. The P/E falls to roughly 17x. Net income drops to about $6.8 billion. Market cap falls to approximately $115 billion. A $35 billion loss from 150 basis points of compression.
Moderate compression to 8.5% ROE: roughly 16x P/E, about $6.4 billion in net income, approximately $102 billion market cap. A $48 billion loss from just 200 basis points.
Full market-rate at 7.0% ROE: roughly 14x P/E, about $5.3 billion in net income, and a market cap of approximately $74 billion. A $76 billion loss.
Two dynamics are compounding here and it is important to understand why. Net income falls as ROE compresses, because the utility is earning less on the same equity base. But the P/E multiple also contracts, because lower ROE produces lower sustainable growth, and lower growth warrants a lower multiple. This is not a behavioral or sentiment assumption. It follows directly from the Gordon Model math. When the growth rate in the denominator falls, the multiple contracts.
At a 7% ROE equal to cost of equity, market cap converges toward 1x book. The premium disappears because the excess return that justified it disappears.
This math applies at the sector level, not to any individual company. The sensitivity is not uniformly distributed. Utilities in states with more aggressive regulatory reform face it sooner. Utilities with large capital plans pushing rates to political flashpoints face it sooner. Utilities that have accumulated social permission problems through reliability failures or high bills face it sooner.
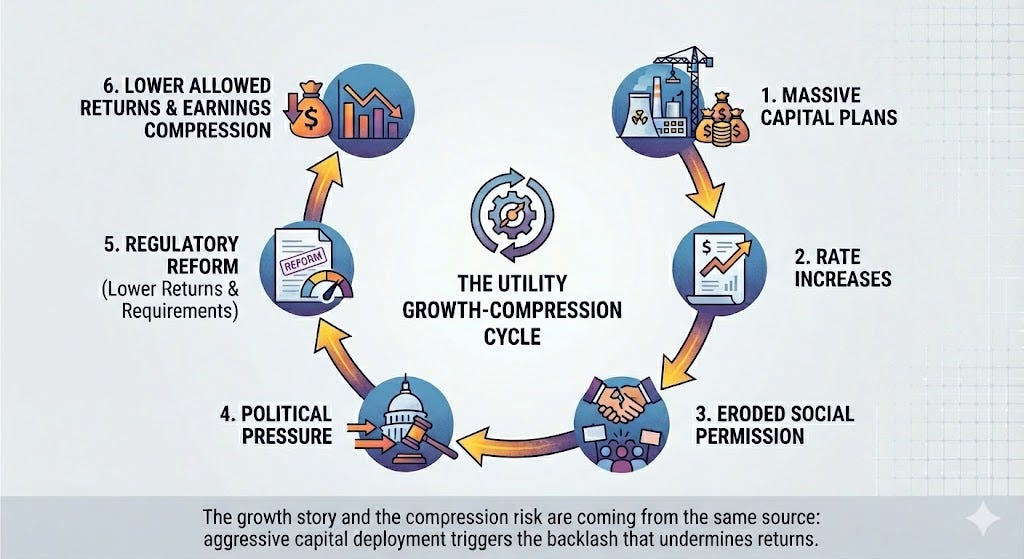
The Feedback Loop
The dynamics described above are not independent. They reinforce each other in a way that is worth mapping explicitly.
Massive capital plans require rate increases to recover the investment and the return on it. Rate increases erode the social permission that underlies the regulatory compact. Eroded social permission creates political pressure on legislators and utility commissioners. Political pressure drives regulatory reform toward lower allowed returns and performance requirements. Lower allowed returns compress earnings and multiples.
The utilities pushing hardest on the capital deployment accelerator are, in a real sense, the ones most likely to trigger the political backlash that compresses the returns their growth stories depend on. The growth story and the compression risk are coming from the same source.
The Opportunity
I want to end this first post where I think the conversation should ultimately land, because the point of this series is not to predict the decline of the utility sector. It is to understand what a better model looks like and where it might come from.
PBR and ROE compression are only existential for utilities that genuinely cannot reduce costs or improve performance and refuse to modernize.
For a utility that can, performance-based frameworks are not a threat. In fact, with an internal utility transformation, they are a massive opportunity.
A utility that can deliver reliability, integrate distributed resources efficiently, defer traditional capital spending through technology and operational excellence, and build genuine customer value can earn more under a well-designed performance framework than it ever earned under cost-of-service regulation. The upside is real.
The distribution grid, operated as an active platform rather than a passive delivery network, has enormous untapped value. The taxi cab industry viewed themselves as a monopoly of supply; today, Uber is worth multiples more as a platform business coordinating resources on the network.
Technologies exist today that can improve reliability and reduce costs. There is still an incredible window of opportunity for new technologies that have yet to be invented because utilities are not prioritizing creating a network-based platform business model.
The economic logic is counterintuitive from the perspective of the traditional utility model: the best outcome for customers is often fewer large capital investments, not more. And under performance-based regulation, the utility that delivers better outcomes with less capital is rewarded for it rather than penalized.
The question is not whether this transition happens. The regulatory and political pressure documented in this post suggests it will… it’s just a matter of time. The question is who leads it. Incumbents that recognize the shift early and restructure their earnings model proactively are in the best position. To do this they need to restructure their teams and perhaps their investor base too.
New entrants that understand the platform economics of a modernized distribution grid are the alternative. It’s not just software. It’s not just culture. It’s a complete package, plus R&D. The monopoly fortress has some cracks in it that are prime for disruptive seasoned executives.
The next post in this series looks at PBR directly: what it was supposed to do, what states have actually tried, and what the cautionary tales from Hawaii and Connecticut tell us about how not to design a performance framework.
Post 1 of 10: The Structural Transformation of the U.S. Electric Utility Industry.
Sources and extended analysis are linked below.
Sources
EQ Research, nine states pursuing PBR (2026) -- subscription-based report
UC Berkeley, “Rate of Return Regulation Revisited” (Werner and Jarvis)
Author’s assumptions note:
The 65% payout ratio is the approximate median for large-cap U.S. electric utilities. The 7% cost of equity is consistent with DCF estimates from RMI (7.9%), the Berkeley Energy Institute’s central CAPM estimate, and Ellis’s market-to-book analysis. The 35% retention ratio driving growth is the complement of payout. These are standard utility finance assumptions, though a reader could reasonably argue for a cost of equity range of 6.5% to 8%, which would shift the implied multiples by 1 to 2 turns in either direction.
Wow so octopus has a data platform named kraken! Small world since the CaDC.org has the same name for its platform and builds on airflow, aws etc
See also the ca governors race where utility bills are a factor… anyway very curious to learn more and steal ideas for the water world where I work.
Also I am very curious to your series from a operational lens with an eye on state capacity https://substack.com/home/post/p-184536785